• Home
    • THE TEAM
  • RESEARCH
    • ARTICLES
  • SYSTEMATIC PORTFOLIOS
  • Contact
  • WEBINARS
  • VIDEOS
    • Exchange Rates
    • Australian Housing
    • Inflation 2022
    • Liquidity & Asset Prices
    • Forecasting PMIs
    • Business Cycle Asset Allocation
Picture
IMPORTANT NOTICE

This website is intended for wholesale and institutional clients only. Neither the company nor this website offers investment advice, either general or specific. No reliance should be placed on, nor action taken in relation to any information or data contained herein. By continuing to view this website you are agreeing that you will take no investment-related action, and that no liability shall rest with AAS Economics, in relation to this website or its contents.


Picture
LATEST: The tidal wave of money creation post-pandemic has now turned in ALL major economies and settings have now moved from boom to bust with enormous post-inflationary shocks ahead ...... Contact us for more information: info@aasecon.com ...
The Power of Accurate Forecasting

Whether it's economic growth, inflation, stock market momentum, yield curves, commodity prices or exchange rates our unique monetary methodology has shown predictive accuracy unrivalled by other forecasting organisations. We show you our forecasts and we show you how we performed.

Download our latest Forecast Review to see what we said, how things subsequently unfolded and how you can benefit from our analysis. Also join our next free Webinar to learn how accurate forecasting can help your portfolios.
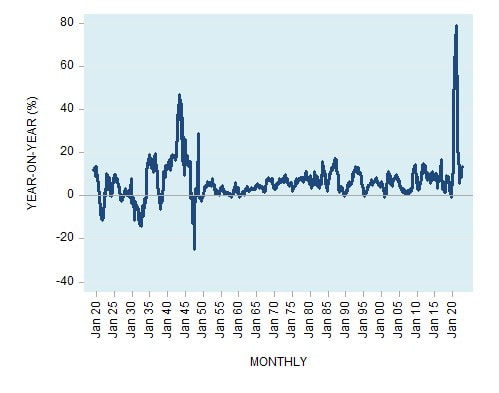
The Most Important Chart in 100 Years?
The US Monetary Cycle Switches from Boom to Bust

Yearly Growth US Adjusted Money Supply 1915 - 2022
Picture

Understanding the logic and implications of this chart is vital to protecting your portfolios over the next two years. We can help you do this.
Welcome to AAS Economics

Applying Austrian Economics to Economic & Market Forecasting

Here you will find access to economic research that is at once unique and challenging.

Through our redefinition of money supply – informed by readings in classical economics – and our advanced quantitative modelling we are able to produce iconoclastic forecasts at the macroeconomic, microeconomic and asset allocation levels in multiple countries across numerous asset classes.

As you will see from the profiles of our Team members, our skillset is broad and deep, ranging from academia to government to financial market advisory to hedge fund management and beyond.

Our clients see us as providing a radical counterpoint to traditional forms of economic and market analysis. We apply consistent themes, based on core principles, to economies and markets even where these economies and markets appear to differ markedly, either geographically or temporally.


Vertical Divider
The AAS Economics Framework

A brief overview of our methodology can be found here in a convenient Q&A format.

The AAS Economics Framework.pdf
File Size: 548 kb
File Type: pdf
Download File

Our Philosophy


​Analyse reality based on first principles
​


​The AAS Economics approach to economic and asset market analysis is simple yet effective.

It is our view – and our observation over many decades – that what we know as the business cycle is predictable. Once the cycle is predicted then the performance of asset classes and individual assets can be better forecast.

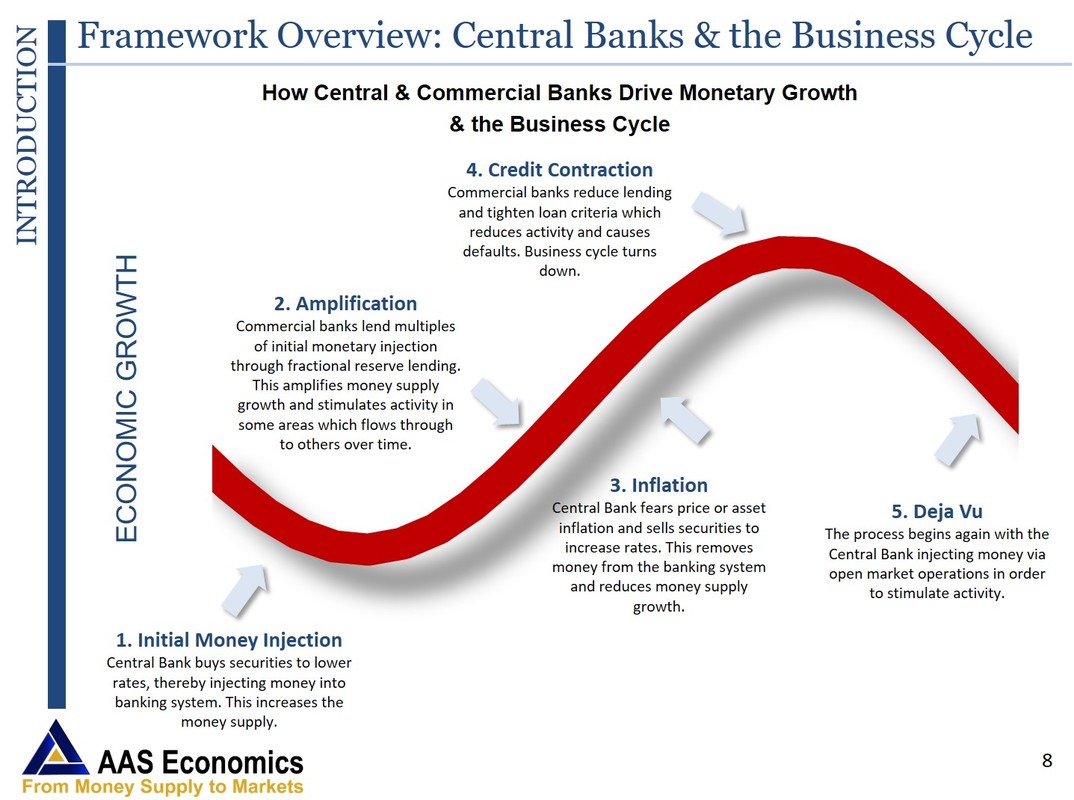
The cycle is primarily caused by monetary, credit and liquidity phenomena. Inflation and contraction of these aggregates (including through interest rate policy) initiated by the central banks and amplified through credit creation by the commercial banks, lead to various outcomes.

Firstly, the actions of the central banks affect the signals received by economic agents in their day-to-day activities. This may manifest in changes in expectations, changes in their time preferences, or other factors.

Secondly, money created by the central banks (for example via open market operations) is picked up by the fractional reserve banking system. The banks, being able to lend multiples of the funds that they have on deposit and in "reserves", begin to create credit – essentially out of thin air – which ripples out into the economy in ways and at speeds that would not have occurred prior to the central banks' activity. This newly created money finds its way unevenly through the economy (the "Cantillon Effect") as some businesses and sectors receive it earlier than others and expand their activity. These early leaders can drag other sectors with them but can also create cost pressures for those sectors not enjoying the largesse, as those other sectors are forced to compete for resources while not seeing a proportionate increase in demand.

This process then results in re-allocated resources throughout the economy while at the same time giving the appearance of generalised economic growth, as more money is deposited with banks who further amplify the cycle through additional fractional reserve lending.

The  newly created credit finds its way not only into product markets but also into asset markets, leading to increases in asset prices - both sectorally and more generally.

Herewith, the boom.

However, as the contradictions created by this credit and liquidity expansion become manifest – for example via prices rising first in some areas and then spreading more widely – the central banks decide that enough is enough and the brakes are applied. Those who have been late to the credit party feel the damage first, as the growth forecasts that formed the basis of their borrowings fail to materialise, their profits decline or turn to losses and their bankers get cold feet.  

Now the process goes into reverse. The banks first begin to restrict lending (or demand repayment or increased collateral) in the sectors highly populated by latecomers and then, when other related sectors begin to decline, this credit contraction becomes widespread.

The mistakes of misallocated capital return to haunt lenders and borrowers alike, with both economic activity and asset prices declining.

Herewith, the downturn.

Sadly, the state may step in to aggravate the process through bailouts of industries deemed  "too big to fail".

And all the while different sectors and different assets are responding in different ways to these changes in credit conditions driven by central and commercial banks.

Eventually, of course, the wheel turns again and the central banks decide that stimulus is required (and often the state more broadly intervenes along similar lines using fiscal and bailout policies). The entire cyclical process, along with its inevitable misallocations of resources, is then re-commenced.
Vertical Divider
Applying the Approach
​
Complexity from Simplicity


​
​Our approach to analysing these leading trends in money, credit and liquidity creation lends itself both to quantitative modelling and to historical testing.

Our first step in modelling each economy and market is the calculation of our key leading indicator, which we call AMS. AMS is a redefinition of money, credit and liquidity using principles derived from Austrian economics.

We then place changes in this variable at the heart of our 300-equation econometric model and use this model to forecast major economic variables and changes in asset prices. Employment, industrial production, real GDP, bond yields, commodity prices, exchange rates and inflation are among the economic variables which we are able to forecast using these techniques (see our Research page).

Given the leads that changes in AMS provide when predicting the business cycle, it is also possible to forecast the health of various specific sectors of the economy as the cycle moves through its various stages. Thus it is possible to use our AMS-driven approach to predict which business sectors are likely to flourish, and which to decline, as the cycle unfolds. For investors this gives valuable, forward-looking sector insights which can assist in stock selection and asset allocation.

Further, it is possible to derive overall asset allocations across multiple classes such as equities, bonds and commodities.

All of these are discussed further in our Research area.

Please don't hesitate to contact us to discuss our work in greater detail.


Vertical Divider
Picture
​2 MINUTE VIDEO
Check out the latest in our 2 Minute Video series here.
FREE WEBINAR
Join our next free Webinar and see what truly accurate forecasting can do for your portfolios. 
Picture
Picture


Download a recent sample Money Supply & Macro chartbook and check out monetary developments in countries around the world, together with the implications of those developments.

AASE - Money Supply & Macro January 2023.pdf
File Size: 2135 kb
File Type: pdf
Download File

MAJOR CALLS OF 2019

​We also made some very big calls in 2019. See how we went.
AASE Major Calls 2019.pdf
File Size: 617 kb
File Type: pdf
Download File

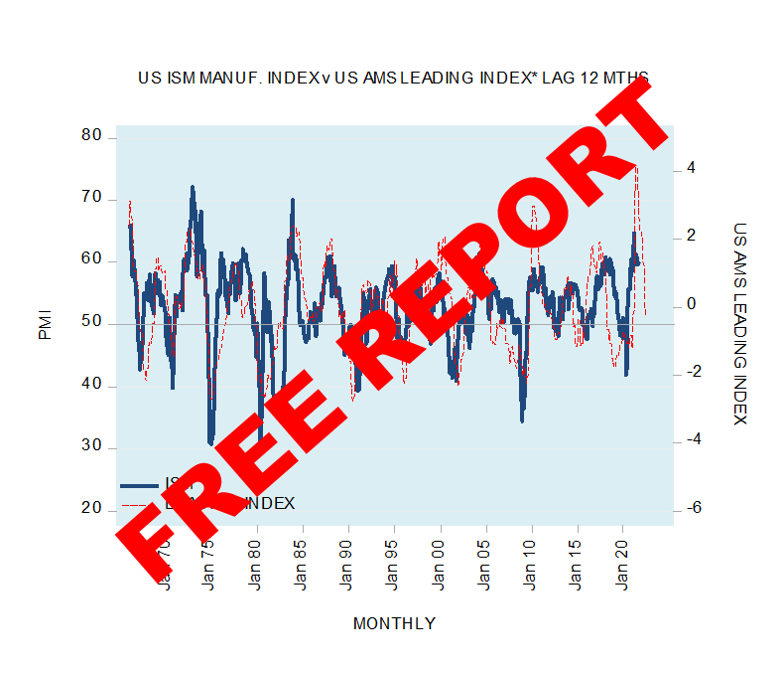
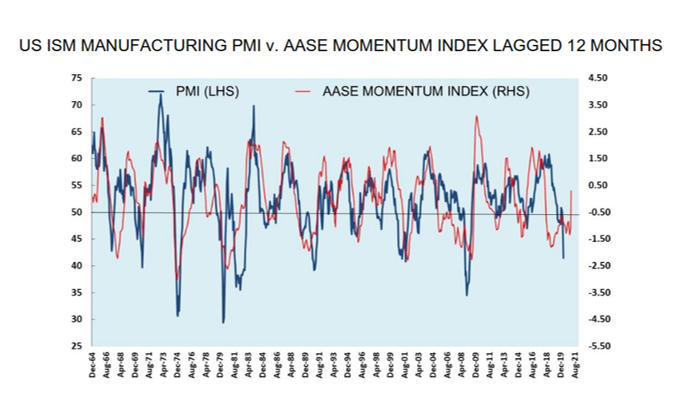
US PMI

​Our PMI forecasting model has correctly called the 2020 rally but the picture for the US is changing. Contact us to learn more.
Picture
The Eurozone, China, Japan, Australia, Canada, the UK - all of the significant economies - face both growth and inflation slowdowns of significant proportions in 2023. Our chart indicators show you where this is heading.

To see these other charts and learn more about our Composite Leading PMI Index series please contact us.

Post-Covid Recovery for the Eurozone now in reverse

As the tsunami of money reverses after the battle of the money versus the virus we will see the implications of this retreat. Learn more about where we see the balance of forces and the time lags involved.  Contact us.

Asset Allocation Using the Business Cycle

See how our unique approach to business cycle forecasting adds alpha.
Picture
Systematic Portfolios
​
​
Check out our notional performance using this unique approach, using changes in money supply to forecast the business cycle, at our Systematic Portfolios page.
Proudly powered by Weebly
  • Home
    • THE TEAM
  • RESEARCH
    • ARTICLES
  • SYSTEMATIC PORTFOLIOS
  • Contact
  • WEBINARS
  • VIDEOS
    • Exchange Rates
    • Australian Housing
    • Inflation 2022
    • Liquidity & Asset Prices
    • Forecasting PMIs
    • Business Cycle Asset Allocation